
By Mary Beth Weaver on Tuesday, February, 27th, 2018 in Blog Posts,Blog: Library Management & Research (LIB),Latest Updates. No Comments
This piece is the second installment of a multi-part series on Data Analytics. See link to the previous Part 1 below, at the base of this post.
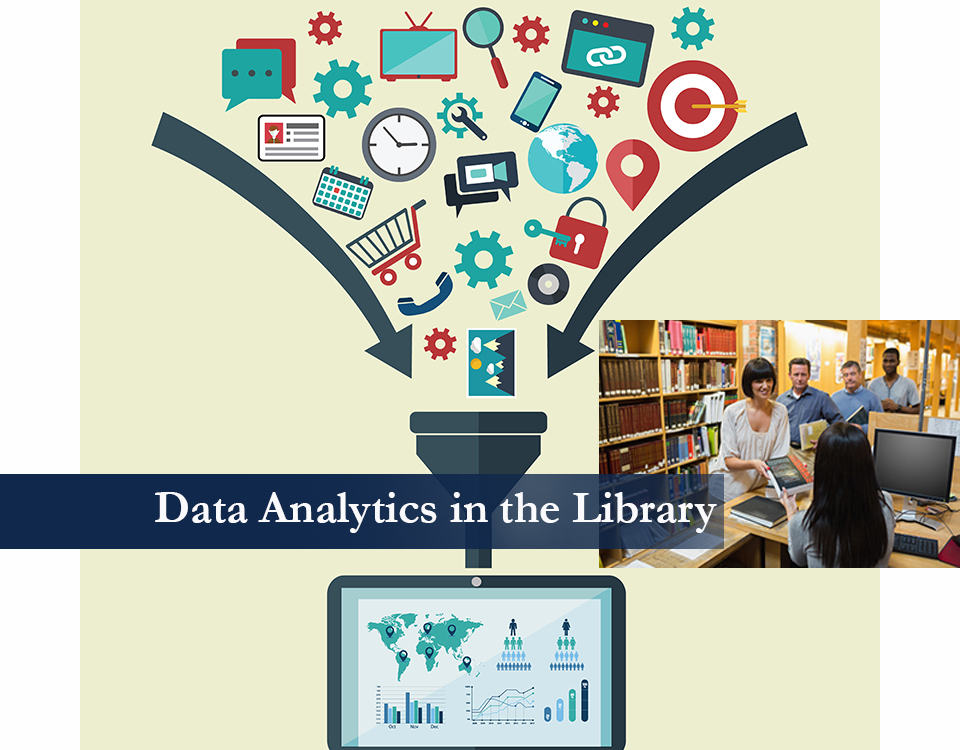
Interlibrary loans are part of the lifeblood of research libraries, bridging the gap between research needs for information and shrinking library budgets. Data analytics, long used to measure the performance of the ILL process, can help libraries with other facets of the profession, including collection development and serials management through bibliometric analysis. Monitoring fill rates and the speed of processing loans can give you averages about how long it takes staff members to go through the process, but this doesn’t help too much beyond seeing who is meeting expectations.
By using other instruments in the data analytics toolbox, however, libraries can track changes in research needs, uncover new resources of information, visually depict the data to view keywords in context and density, as well as analyze false hits, and draw new conclusions based on analyzing the visualized data. Additionally, bibliometric analysis can help to track the sources of journals for the kind of requests the library commonly receives. By analyzing the keywords and Boolean phrases that lead librarians to these journals, data analytics through library bibliometrics can provide shortcuts to meaningful search results.
Bibliometrics is reliant on good sources to conduct the searches, and the data found must still be cleaned by identifying and removing false hits. As any librarian knows, every open-ended search will have significantly more false hits than reliable ones. A wide array of flexible tools, such as VosViewer, Gepghi, or Sci2 (among others), allow data manipulation for a variety of uses, including presenting the information in new and engaging ways and allowing data to be looked at in more useful ways by moving beyond traditional search metrics.
Bibliometrics requires behind the scenes work and tools to get started, however the time saved due to efficient searches and manageable data can make up for this cost.
——–
Follow Cadence Group as we explore realistic and actionable approaches to get analytics programs off the ground. View our success stories where we create highly successful analytics programs. Follow us as we post more about data analytics in the coming future for actionable strategies and information. For more information on how we apply that knowledge and know-how through a customized level of service see our Practices Page. For more information specific to Library Services, check out Cadence Group’s Library Management & Research Practice Page.
This piece is the second installment of a multi-part series on Data Analytics.
See part 1 of this series: Getting your Analytics Program off the Ground: The Impact of Analytics.
Cadence Group co-writers on this article include: Brynne Norton, Mary Beth Weaver, and Marcus Durand.