By Marcus Durand on Friday, August, 4th, 2017 in . No Comments
Problem:
Collection, analysis, and reporting of communications metrics data is necessary, to understand and optimize usage of communications products, in order to improve natural search results and effectively reach/engage intended audiences.
Solution:
Cadence Group provides onsite staff to public health offices to develop, maintain, update, and improve their website, Intranet, blog, database, publication, e-mail bulletin, and social media assets.
Cadence Group staff monitors, compiles, and reports on metrics for each of these communication assets, utilizing tools such as HTML & JavaScript, Adobe Analytics, Google Analytics, Foresee, Userzoom, Altmetric, GovDelivery Reports, & Twitter Analytics, and Excel.
Cadence Group staff compiles specific data, creates presentations, prints materials, and advises office management on trends, tools, and progress to expand viewership across a wider audience.
Outcome:
Cadence Group staff provides communications metrics data to demonstrate the direct impact electronic content is having on an audience, enabling an office to better leverage content to accomplish communication objectives. This effort improves web site usage, Search Engine Optimization (SEO), accessibility (section 508 requirements), and User eXperience (UX).
Examples:
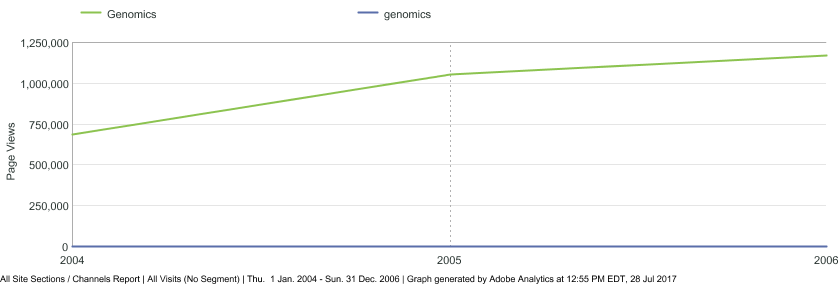
Web stats – During a 2 year span, our web staff helped to improve the Genomics site usage by about 500,000 annual views.

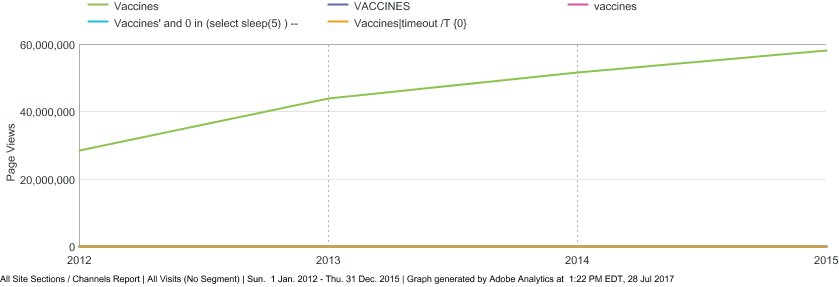
During a 3 year span of monitoring and advising clients on Vaccines web stats, our web staff showed a gain of 29,510,451 annual views.

SEO – With surveillance and modifications to web content/meta data, our web team were able to gain and maintain linkages in the top 3 results across major search engines for several years.
508 – With monthly surveillance and modifications across 43 sites in NCIRD, our web staff are able to maintain around 98% accessibility compliance for our sites, topping the 82% compliance requirements across CDC.

